Hunting the N+1 Query Problem with a Roslyn Analyzer
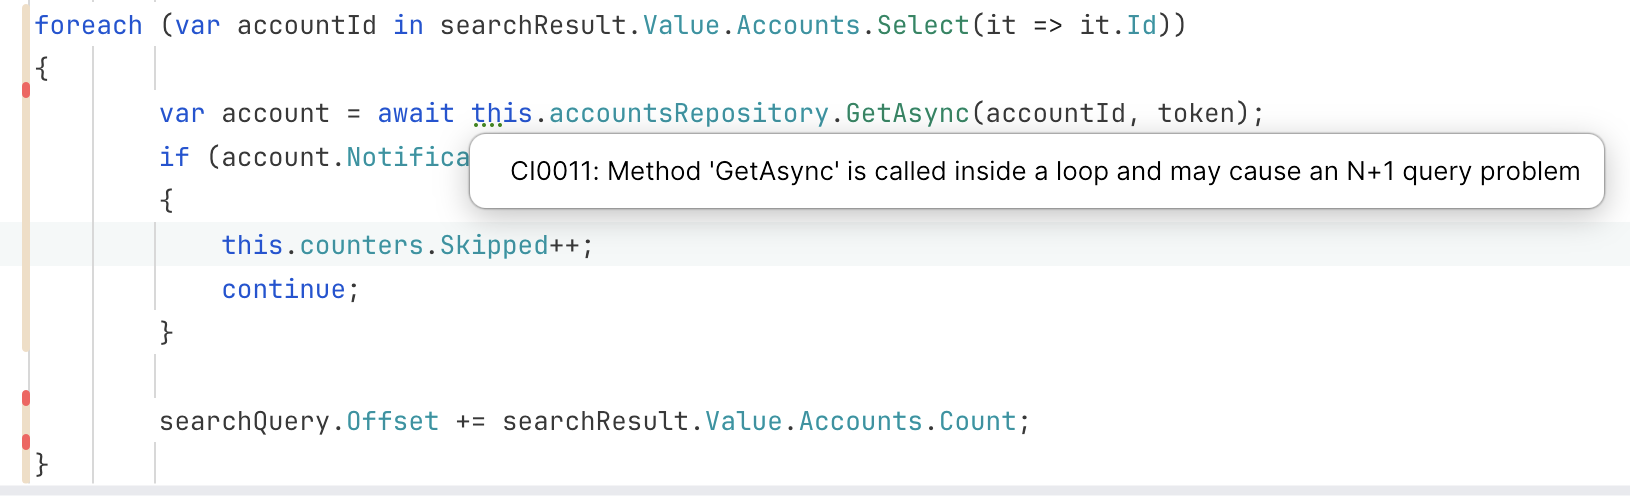
Most collection-related performance advice stops at the method boundary: avoid redundant ToArray() calls, pre-size your List<T>, swap a linear Contains() scan for a HashSet<T>. Those micro-optimizations matter, but they pale in comparison to a much bigger and much more common mistake — the N+1 Query Problem.
I ran into this pattern so often while working on Collections.Analyzer, my Roslyn-based static analysis tool for .NET collections, that I decided to build a dedicated diagnostic for it: CI0011.
What the N+1 Query Problem Looks Like
The name comes from the ORM world, where lazy-loading can quietly create problems::
// 1 Query: Fetches all 100 blogs from the database
var blogs = await _context.Blogs.ToListAsync();

foreach (var blog in blogs)
{
    // N Queries: Fired 100 times to get posts for each individual blog
    Console.WriteLine(blog.Posts.Count);
}
// Total = 101 database roundtrips!
This is a classic example with Entity Framework.
But the pattern shows up everywhere data access meets a loop even if you don't use an ORM, lazy-loading, or DbContext directly:
public void ProcessOrders(IEnumerable<int> orderIds)
{
    foreach (var id in orderIds)
    {
        // N Queries: Fired N times to get all orders
        var order = _orderRepository.GetById(id);
        Process(order);
    }
}
Entity Framework gives us a few ways to fix this..
Use eager loading with Include() to combine queries in one:
var blogs = await _context.Blogs
    .Include(b => b.Posts) // Forces EF to join and pull everything at once
    .ToListAsync();        // Exactly 1 database query
Create a new projection:
var blogSummaries = await _context.Blogs
    .Select(b => new BlogDto
    {
        Id = b.Id,
        Name = b.Name,
        TotalPosts = b.Posts.Count // Handled on the database side
    })
    .ToListAsync(); // Exactly 1 database query
But what if we do not have any ORM and work with storage directly? We cannot include and combine queries. The solution is - use batch queries:
public void ProcessOrders(IEnumerable<int> orderIds)
{
    var orders = _orderRepository.GetByIds(orderIds); //Get all orders in one query
    foreach (var order in orders)
    {
        Process(order);
    }
}
Fetch everything once, then work with it in memory. You should remember that every query to the storage (or another service) is expensive – connection establishment, selecting data, transmitting data, dematerialization. And every step can fail, decreasing overall reliability. So, you should minimize the number of round trips.
Simple in theory — but this bug is notoriously easy to miss on code review because the context is often spread across multiple classes and files. That's exactly why it needs static analysis rather than a human eyeballing a diff.
Real Examples From Production Code
I tested the diagnostic against several real production codebases, and the patterns it caught fall into a few recurring shapes.
The classic loop. Nothing fancy, just a repository call sitting inside a foreach:
public void Execute()
{
    foreach (var formId in formWithDisabledRCsDataReader.Read().ToArray())
    {
        var form = formReader.Read<CabinetReqForm>(formId);
        SendNotification(form);
    }
}
LINQ hiding the loop. No foreach in sight, but the lambda inside Select still hits the repository once per item:
public FileMeta[] GetFileMetas(Guid[] fileIds)
{
    return fileIds.Select(fileId =>
    {
        var fileReference = cryptoRepository.Read<FileReference>(fileId);
        return cryptoRepository.Read<FileMeta>(fileReference.FileMetaId);
    }).ToArray();
}
Chained LINQ obscuring multiple lookups. The more Select/Where calls you chain, the easier it is to lose track of how many times you're hitting storage:
private bool WasVerifiedByOperator(File file, IEnumerable<DocumentVerificationInfo> documentVerifications)
    => documentVerifications
        .Where(v => v.OperatorTaskId.HasValue)
        .Select(v => v.OperatorTaskId.Value)
        .Select(taskId => operatorTaskHandler.Read(taskId))
        .Where(task => task.DocType == file.DocType)
        .Select(task => task.VerifiableFileId)
        .Select(fileId => fileReader.ReadIncludingDeleted(fileId)) // Here is a call
        .Any(f => f.FileDescriptorId == file.FileDescriptorId);
How the Diagnostic Actually Works
Creating the CI0011 diagnostic, I tried to replicate how I'd manually review this kind of code:
- Find a loop or a complex LINQ expression (
Select,Where, and similar). - Track the loop variable's usage inside the body.
- Look for that variable being passed into a method that looks like a data-access call — a method starting with
Read,Find,Get,TryRead,TryGet, orTryFind, defined on a type whose name ends inRepository,Reader,Writer, orHandler. - Exclude calls that already batch — methods containing
Batch,Bulk, orRangein their name, or ones that accept a collection parameter. - Whatever's left gets flagged as a
Warning: a likely N+1 query.
Why It Needs Configuration
"Repository," "Reader," "Handler" — these aren't C#-language constructs. .NET has no idea what a repository is; that meaning exists only in your team's conventions. So a diagnostic built on naming patterns has to be configurable, or it will either miss real problems or drown you in false positives.
All of it is controlled through .editorconfig:
# Add your own data-access method prefixes (e.g. include update/delete methods)
dotnet_diagnostic.CI0011.data_access_method_prefixes = Get, Fetch, Update, Delete

# Extend which type names are treated as data-access types
dotnet_diagnostic.CI0011.data_access_type_substrings = Repository, SpamClient, MyServiceClient

# Extend which method names are treated as already-batched
dotnet_diagnostic.CI0011.bulk_method_substrings = Batch, Bulk, Multi, Collection

# Opt in to analyzing test methods (off by default)
dotnet_diagnostic.CI0011.analyze_test_methods = true
Limitations
- In default configuration, this diagnostic will miss anything like
fileManager.Fetch()that doesn't match the configured prefixes/suffixes. - Methods with collection parameters like
Get(int[] ids)are also ignored. - Types
stringandbyte[]are not considered as collection types, soGet(byte[] id)orGet(string id)will fireWarning. - Test methods are ignored by default. The analyzer recognizes the following attributes:
[FactAttribute],[TheoryAttribute],[TestAttribute],[TestCaseAttribute],[TestFixtureAttribute],[TestMethodAttribute],[TestClassAttribute]
No Auto-Fix — On Purpose
Unlike simpler diagnostics in the analyzer (redundant ToArray(), missing List<T> capacity), N+1 issues don't have a mechanical fix.
The batch method you need might not exist yet, or the fix might require a broader refactor of the calling code. So CI0011 doesn't ship a code fixer — it just points you at the problem.
In practice, that's enough: most flagged cases turn out to have a straightforward batch alternative once you look for it.
Takeaway
Collection-level micro-optimizations save you memory and allocations, and that adds up at scale.
But a single missed batch call can cost orders of magnitude more than anything you'd gain from optimizing in-memory operations — a network round trip and a database query dwarf the cost of iterating an array. If you're building or tuning a static analyzer for a real codebase, catching N+1 patterns across loops and LINQ chains is worth far more attention than shaving allocations off a List<T> initializer.
Collections.Analyzer, including the CI0011 diagnostic described here, is available on NuGet. The CI0011 documentation has the full list of configuration options and default values.
Installation
Add a package reference to a project:
<PackageReference Include="Collections.Analyzer" Version="0.3.0" />
The analyzer will work only in the project it was added to. If you want to analyse all projects in your solution, you can add file Directory.build.props to the solution directory with content:
<Project>
  <ItemGroup>
    <PackageReference Include="Collections.Analyzer" Version="0.3.0" />
  </ItemGroup>
</Project>